


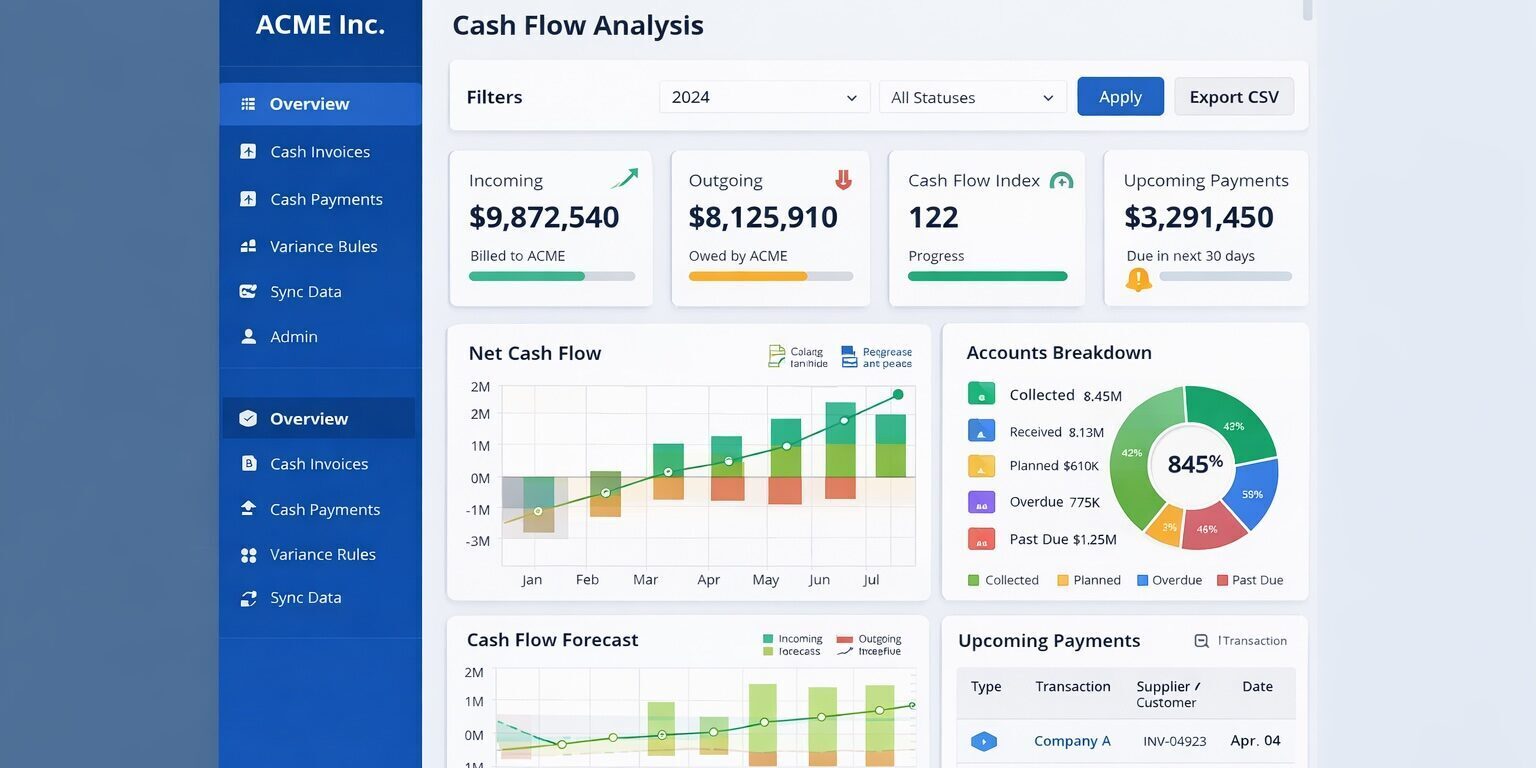
You deserve a clear, immediate view of your company’s financial commitments. A real-time cash exposure dashboard puts you firmly in control of your working capital by consolidating critical purchasing and finance data in one place. Instead of sifting through spreadsheets or toggling between multiple systems, you can instantly see open purchase orders, goods received, spend trends, and upcoming supplier payments. Praxie’s Cash Flow Analysis app is designed to do just that, giving you direct insight into how money flows in and out of your organization. By understanding exactly where your cash exposure stands at any given moment, you can identify risks, plan intelligently, and protect your bottom line. When you have these insights at your fingertips, decision-making stops feeling like guesswork and starts feeling like a well-orchestrated strategy.
In this article, you’ll discover how a real-time cash exposure dashboard helps you act quickly to resolve potential issues, stay ahead of supplier performance problems, and pinpoint exactly where your company stands financially. You’ll also learn how Praxie’s Cash Flow Analysis app connects all the dots—from open purchase orders to monthly spend trends—so you can confidently steer your organization’s finances. Whether you’re balancing multiple vendors, large purchase orders, or simply want to ensure a healthy cash position, a unified dashboard can make your life far simpler. Let’s dive into the features and best practices that help you gain total visibility over your cash flow.
Embrace a single dashboard approach
When your financial data is scattered across countless spreadsheets, email threads, and disparate tools, it’s nearly impossible to get a complete picture of your company’s cash exposure. You might have purchase orders in one system, receipts in another, and spend analyses floating around in a shared drive. Not only is this inefficient—it’s risky. Gaps in information can lead you to overlook urgent payment issues and supplier disputes.
A single dashboard pulls all those fragments together into one cohesive, up-to-date view. Rather than flipping between tabs or hunting for the most recent spreadsheet version, you can log into a central platform and see everything that matters: real-time cash exposure, upcoming commitments, and high-level trends that indicate how money is flowing in and out. A single, comprehensive view also reduces the likelihood of inaccurate data. When multiple stakeholders rely on a shared dashboard, data entry errors and conflicting numbers often come to light quickly, because the entire team sees the same metrics.
Why centralization matters
By unifying all your finance and purchasing activities, you’re essentially building a reliable command center for cash flow management. This centralization means you have a trusted source of truth for decisions that affect your company’s financial health. If you’re in the finance department, you can quickly spot impending cash shortages and act before they become crises. If you work in purchasing, you can track when items were received, how much is owed, and whether any orders are running behind. Everyone stays aligned because there’s no question about which numbers are correct—they’re all in the same place.
Centralization also makes collaboration more efficient. Suppose you need a green light from a manager to release funds for a supplier payment. Instead of emailing a PDF or waiting until your next meeting, you can mark the status or request approval directly in the dashboard. Once approved, that update is visible to everyone. This real-time insight keeps your entire team informed about financial commitments, reducing misunderstandings and workflow bottlenecks.
Link open purchase orders seamlessly
Purchase orders are often the starting point for major expenses. You raise a request, get it approved, and commit funds. Despite their importance, these orders can quickly multiply and become unwieldy to track. When you stitch purchase orders together with other data—such as goods received or invoice information—you get a fuller understanding of your commitments. With Praxie’s Cash Flow Analysis app, you gain real-time visibility into each open PO, including its status and any associated invoices, so you see not just what you plan to spend, but what’s already in the pipeline.
Linking open purchase orders directly into the dashboard serves two main purposes. First, it ensures no financial commitment goes unnoticed, so you can prepare for payments before they come due. Second, it reveals potential supply chain hiccups—like overdue deliveries or unusual price deviations from suppliers. If you spot that one supplier consistently bills more than your original PO, you can investigate the discrepancy before it impacts your budget.
Stay on top of new requests
A real-time cash exposure dashboard also helps you manage newly created purchase orders more efficiently. When a new PO is raised, you can see it in the dashboard immediately, which prompts you to evaluate whether the purchase is still within budget or if you need to rebalance priorities. Often, high-level executives and finance managers don’t have the time to sift through each individual PO. A unified dashboard provides an at-a-glance summary that helps you quickly spot any red flags or anomalies involving large amounts or suspicious purchasing patterns.
With filters in place, you can sort POs by approval status, department, or spending threshold. For instance, you might want to track all POs over a certain dollar amount or review any that are more than 30 days old. This real-time categorization ensures you focus your time on the most pressing issues. Instead of rummaging through endless lines in a spreadsheet, you simply apply a filter and see an organized snapshot of exactly what you need.
Monitor goods received in real time
Open purchase orders only tell half the story. You need to pair them with what’s actually happening in your warehouses, stockrooms, or workplaces. Did your supplier deliver everything on time? Are partial shipments causing confusion between purchasing and finance? By adding real-time goods received data to your cash exposure dashboard, you transform raw PO numbers into a living, accurate depiction of current inventory and associated costs.
When your teams mark goods as received, that data instantly appears in the dashboard, giving you immediate insight into whether you’re on track with your purchasing plans. If a partial delivery arrives, you can see the exact quantity delivered against the total ordered. You then know exactly how much of the PO is still pending, so you can forecast cash outflows more accurately. Detailed, real-time receipts also highlight any unexpected delays, because if only 60% of your order arrived and it’s already past the promised delivery date, there’s a signal that something might be stalled.
Avoid the mismatch trap
A mismatch between the PO and received goods is a classic recipe for financial miscalculations—especially if you count on the arriving materials for a major project or manufacturing run. If, for instance, your inventory management system shows items have not arrived but your supplier insists they shipped, you want to catch that discrepancy quickly. A real-time cash exposure dashboard combines these data points, prompting alerts when deliveries fall short or exceed the original order quantity.
That immediate visibility helps you balance your books accurately. If goods arrive but accounts payable hasn’t updated, you’re likely to either over-pay or miss an invoice payment. Conversely, if the supplier’s invoice doesn’t match the received items logged in your system, the dashboard highlights the mismatch in real time. This clarity sharpens your financial accuracy and reduces the administrative headache of reconciling multiple records later on.
The All-in-One AI Platform for Orchestrating Business Operations
 Instantly create & manage your process Use AI to save time and move faster Connect your company’s data & business systems
Spot spend trends instantly
Knowing your overall spend patterns is indispensable for strategic decision-making. Are certain months significantly higher in outflows than others? Do holiday seasons or annual events drive spikes in spending? By analyzing these trends month-over-month or year-over-year using a real-time cash exposure dashboard, you can foresee dips and peaks and prepare your budgets accordingly.
Praxie’s Cash Flow Analysis app includes visual indicators, graphs, and charts that make spend trends easy to digest. Instead of scanning raw data, you can spot patterns at a glance. For instance, the dashboard might show that vendor spending jumped 15% compared to the prior quarter, indicating you might need to renegotiate terms or review your purchasing approach. Alternatively, you might notice your spending decreased for specific categories over time, confirming that certain cost-saving measures are working. The best part is that these insights are live and dynamic. You don’t have to wait for the month-end close or a dedicated analyst to crunch the numbers. You simply sign in and see exactly where you stand.
Align departments on spending
One of the most underrated benefits of spotting spend trends in real time is how it facilitates open communication between departments. Procurement might see a sudden surge in costs for a specific product line, while finance might notice a corresponding increase in inventory holding costs. Without a unified view, these observations might stay compartmentalized, delaying any corrective actions. A shared dashboard helps everyone be proactive rather than reactive. Teams can discuss trends, brainstorm solutions, and enact changes quickly if spending swells beyond expectations.
If your company’s leadership wants an update on the quarterly numbers, you can capture that data right away without spending hours in spreadsheets. That means fewer last-minute scrambles for information and more time to tackle core responsibilities. Real-time spend trend tracking allows your entire organization to speak the same language about budgets, expenses, and cost optimization initiatives.
Use filters to uncover risk
While a real-time cash exposure dashboard is invaluable for big-picture planning, sometimes the devil is in the details. That’s where filters come into play. You can filter by PO status, invoice amounts, departments, regions, or even supplier performance metrics. This functionality helps you zero in on specific areas that might pose a risk to your cash flow—such as overdue invoices, delayed shipments, or sudden price increases from a particular supplier.
Even though broad overviews are necessary for strategic planning, diving deeper with filters lets you investigate pressing concerns that could hurt your bottom line if left unaddressed. If you see a cluster of overdue orders, you can filter by that criterion to isolate the cause. Perhaps it’s a single vendor who repeatedly pushes deadlines, or maybe an internal process causes bottlenecks in approving invoices. Once you identify the root cause, you can address it head-on before it spirals into larger financial problems.
Examples of risk-based filters
- Overdue commitments: Filters all items that have exceeded their original due date, flagging them as urgent cases.
- Payments above a certain threshold: Helps you quickly isolate large expenses that significantly impact your cash flow.
- Long processing times: Allows you to review cases where invoice approvals took longer than, say, 14 days. This might indicate process inefficiencies or a lack of resources.
- Partial deliveries: Identifies orders that were only partially fulfilled, pointing to potential supply chain disruptions.
By customizing these filters to your unique business needs, you can transform raw numbers into actionable insights. Instead of being overwhelmed by every single transaction, you can focus on the information that requires immediate attention.
Track supplier performance
Finance teams often dwell on deadline compliance and costs, but supplier performance is equally vital for predicting future cash needs. A supplier who repeatedly short-ships or delays deliveries can thwart your budget and inventory plans. Tracking supplier performance in real time ensures you see which partners are consistently reliable and which ones might be causing hidden costs.
Praxie’s Cash Flow Analysis app makes it straightforward to gauge performance metrics—like how often a supplier meets delivery promises or how frequently purchase order amounts match invoices. You can immediately see if issues such as price increases or recipe changes (for manufacturers) are becoming more frequent. If you spot patterns of poor performance, you can negotiate new contract terms or look into alternatives. If you’re dealing with significant potential risk, you might also explore specialized supplier risk management software to get even deeper insights into supplier reliability and long-term stability.
Strengthening relationships proactively
A real-time cash exposure dashboard featuring supplier performance data doesn’t just help you weed out poor performers. It also helps you reward those suppliers who consistently deliver on time and invoice accurately. Data-driven insights into positive performance can be the starting point for building stronger vendor relationships. With visibility into each supplier’s track record, you can collaborate more productively, craft beneficial contract terms, or negotiate better payment schedules.
Moreover, many suppliers appreciate a transparent approach. When you openly share performance metrics, vendors often take corrective actions to maintain a good standing. This avoids the blame game, streamlines communication, and keeps your operations running smoothly. Ultimately, by regularly monitoring vendor performance, you reduce last-minute disruptions, stabilize your cash flow, and forge the kind of relationships that benefit both sides in the long run.
Plan upcoming commitments proactively
You know the uneasy feeling of not being entirely sure what’s coming down the pipeline for next quarter’s purchases. Having a real-time cash exposure dashboard significantly reduces that uncertainty. By linking upcoming purchase orders, anticipated deliveries, and average spend trends, you get a clear picture of exactly how much money you’re likely to spend in the weeks or months ahead. This foresight makes all the difference between being prepared with adequate cash reserves and scrambling to cover unplanned expenses.
With time-based views in the dashboard, you can quickly spot which big orders are projected for the next 30, 60, or 90 days. If there’s a major spend event two months from now—perhaps an annual product restock or a seasonal promotion—you’ll see it well in advance. That allows you to adjust budgets or initiate additional funding or financing arrangements. Seeing commitments laid out chronologically also helps you schedule payments in a way that optimizes your working capital. You might decide to group smaller payments together or negotiate payment terms that stagger larger outflows over multiple months.
Getting granular with forecasting
Forecasting isn’t just about large-scale events. Sometimes, incremental, smaller commitments can sneak up on you. A dashboard that highlights every upcoming order—no matter how small—prevents you from underestimating those cumulative expenses. You can spot patterns like repeated monthly orders for specific items or add-ons to existing contracts that slowly inch up total spending. By comparing this data to your historical spend periods, you get a sense of whether you’re on track or trending above normal rates.
When you see that you’re likely to surpass your typical monthly spend, you can implement cost controls ahead of time. For instance, you might formalize a new approval process for any purchase over a certain dollar amount or encourage a review of viable alternatives. Accurate forecasting, backed by current data, also strengthens your negotiating power with vendors. If you notice a surge in orders from one supplier, you can approach them to discuss volume discounts or other favorable terms.
Manage working capital more strategically
At the end of the day, your real-time cash exposure dashboard is all about preserving and optimizing working capital. When you continuously track where money is going—and how fast it’s leaving your accounts—you can dodge bottlenecks and keep your company’s financial engine humming. Real-time visibility helps you catch late supplier payments or delayed collections, which can significantly strain cash resources. It also alerts you when purchasing patterns spike, giving you a chance to reshape budgets or postpone non-essential expenditures.
One of the most valuable aspects of a real-time dashboard is that it ties short-term actions to long-term strategy. For example, you might be able to negotiate early-payment discounts with key suppliers if you’re consistently proving your on-time payments and stable cash position. Alternatively, when you see that your outflows are slated to be heavy in a given month, you can plan around that by pulling back on discretionary spending or adjusting your credit lines. This dynamic approach keeps you agile. Rather than being blindsided by financial statements at the end of the quarter, you already know what to anticipate, and you’ve taken steps to address any shortfalls.
Building a more resilient finance function
Robust working capital management goes hand in hand with risk mitigation. By comparing month-over-month (MoM) and year-over-year (YoY) spend data, you gain a bird’s-eye perspective on your cash flow trajectory. This data can shine a light on patterns in supplier risk, payment cycles, or even internal spending habits that might affect liquidity. You’re effectively building a finance function capable of weathering unexpected hits, such as a sudden drop in sales or a spike in material costs.
Moreover, the same functionalities that help you understand risk can become early warning systems. If you ever see a major client who consistently takes 60 days to pay, you can take steps to reduce that window by adjusting payment terms or incentivizing prompt payments. Every piece of the dashboard—PO tracking, goods received, supplier performance, spend trends—works together to strengthen your corporate resilience. The goal is to cultivate an environment where financial surprises are minimal and well-managed if they arise.
Key takeaways
A real-time cash exposure dashboard can revolutionize how you manage your organization’s financial commitments. By linking open purchase orders with goods received data, you always know which orders still need to be fulfilled, and by spotting spend trends early, you anticipate potential challenges before they escalate. Filters help you drill down into specific risk areas—whether that’s overdue invoices or suppliers that continually miss deadlines. Meanwhile, monitoring supplier performance not only flags possible delays but also guides you in forming strong, beneficial partnerships.
Praxie’s Cash Flow Analysis app integrates these capabilities into one cohesive platform, turning what used to be an endless juggle of spreadsheets and emails into an easy-to-navigate dashboard. You gain real-time visibility over upcoming commitments so you can safeguard your working capital and act decisively when costs surge or deliveries lag. By centralizing everything, from purchase orders to month-over-month spending, you ensure team alignment and record accuracy. Next time you’re unsure about your budget allocations or worried about missing a crucial payment deadline, remember that a single dashboard can clear away the confusion.
Whether you’re a finance professional responsible for balancing cash flow or a procurement specialist tracking multiple POs, a unified, real-time cash exposure dashboard puts you in the driver’s seat. You’ll find opportunities to reduce risk, improve forecasting, and strengthen supplier relationships—ultimately supporting a healthier, more agile organization. If you’re ready to elevate your financial planning and control, tapping into the power of a real-time dashboard is a step in the right direction. It’s not just about seeing today’s numbers, but also about setting your company up for ongoing success in the future.
The All-in-One AI Platform for Orchestrating Business Operations
Instantly create & manage your process Use AI to save time and move faster Connect your company’s data & business systems
