


 Dylan Hoback
Accu-Tube
Dylan Hoback
Accu-Tube
My Praxie analytics software transformed our operations, enabling data-driven decisions and streamlining our manufacturing process.
Replace static spreadsheets and manual quality reports with AI that builds live quality KPI dashboards, surfaces defects and trends, and drives action in real time.
A super fast way to see how AI quality dashboards work for your team.
Customer Success Stories
Dylan Hoback
Accu-Tube
“My Praxie analytics software transformed our operations, enabling data-driven decisions and streamlining our manufacturing process.
 Jason Carpenter
Environmental Pest Management
Jason Carpenter
Environmental Pest Management
“With Praxie, I found a way to take what was in documents and spreadsheets and provide my team with a visual application environment to drive our strategy with full accountability.
 Elizabeth Pridham
Perfection Fresh
Elizabeth Pridham
Perfection Fresh
“Praxie dramatically improved our process through digital transformation. We now have visibility and can drive decisions at a fraction of the time.
 Scott Russell
NUCOR Vulcraft
Scott Russell
NUCOR Vulcraft
“I would heartily recommend the Praxie team to any organization seeking to seriously undertake a lasting and successful innovation process.
 Mike Bainbridge
Dover Food Retail
Mike Bainbridge
Dover Food Retail
“Our MFG Ops application greatly improved our daily management initiatives. It is easy to see how we are doing, identify issues, and track improvements—no matter where we sit.
 Jeff Piotrowicz
ChemLink
Jeff Piotrowicz
ChemLink
“With Praxie we've created a way to report on complex projects that gives management full visibility. Executives have visibility to projects, assignments, and more at their fingertips.
 Maureen Thompson
American Nurses Association
Maureen Thompson
American Nurses Association
“Our Praxie App makes it easy to track progress on strategic objectives across the organization and includes an executive-level dashboard with real-time reports to the board on key initiatives.
 Tom Anderson
Springfield Armory
Tom Anderson
Springfield Armory
“Praxie is used every day to track and analyze every aspect of production, quality, safety, and more. We improved quality by 10%.
 Peggie Pelosi
Innovators Alliance
Peggie Pelosi
Innovators Alliance
“Almost overnight, Praxie created a customized solution for our 100 member organizations across Canada to drive strategy and innovation.
 Kate Merton
Anthem
Kate Merton
Anthem
“Praxie's innovation solution stood out from other options because it can be customized so quickly to fit our exact process requirements. Plus, it is incredibly easy to use and manage.
Dylan Hoback
Accu-Tube
“My Praxie analytics software transformed our operations, enabling data-driven decisions and streamlining our manufacturing process.
Jason Carpenter
Environmental Pest Management
“With Praxie, I found a way to take what was in documents and spreadsheets and provide my team with a visual application environment to drive our strategy with full accountability.
Elizabeth Pridham
Perfection Fresh
“Praxie dramatically improved our process through digital transformation. We now have visibility and can drive decisions at a fraction of the time.
Scott Russell
NUCOR Vulcraft
“I would heartily recommend the Praxie team to any organization seeking to seriously undertake a lasting and successful innovation process.
Mike Bainbridge
Dover Food Retail
“Our MFG Ops application greatly improved our daily management initiatives. It is easy to see how we are doing, identify issues, and track improvements—no matter where we sit.
Jeff Piotrowicz
ChemLink
“With Praxie we've created a way to report on complex projects that gives management full visibility. Executives have visibility to projects, assignments, and more at their fingertips.
Maureen Thompson
American Nurses Association
“Our Praxie App makes it easy to track progress on strategic objectives across the organization and includes an executive-level dashboard with real-time reports to the board on key initiatives.
Tom Anderson
Springfield Armory
“Praxie is used every day to track and analyze every aspect of production, quality, safety, and more. We improved quality by 10%.
Peggie Pelosi
Innovators Alliance
“Almost overnight, Praxie created a customized solution for our 100 member organizations across Canada to drive strategy and innovation.
Kate Merton
Anthem
“Praxie's innovation solution stood out from other options because it can be customized so quickly to fit our exact process requirements. Plus, it is incredibly easy to use and manage.


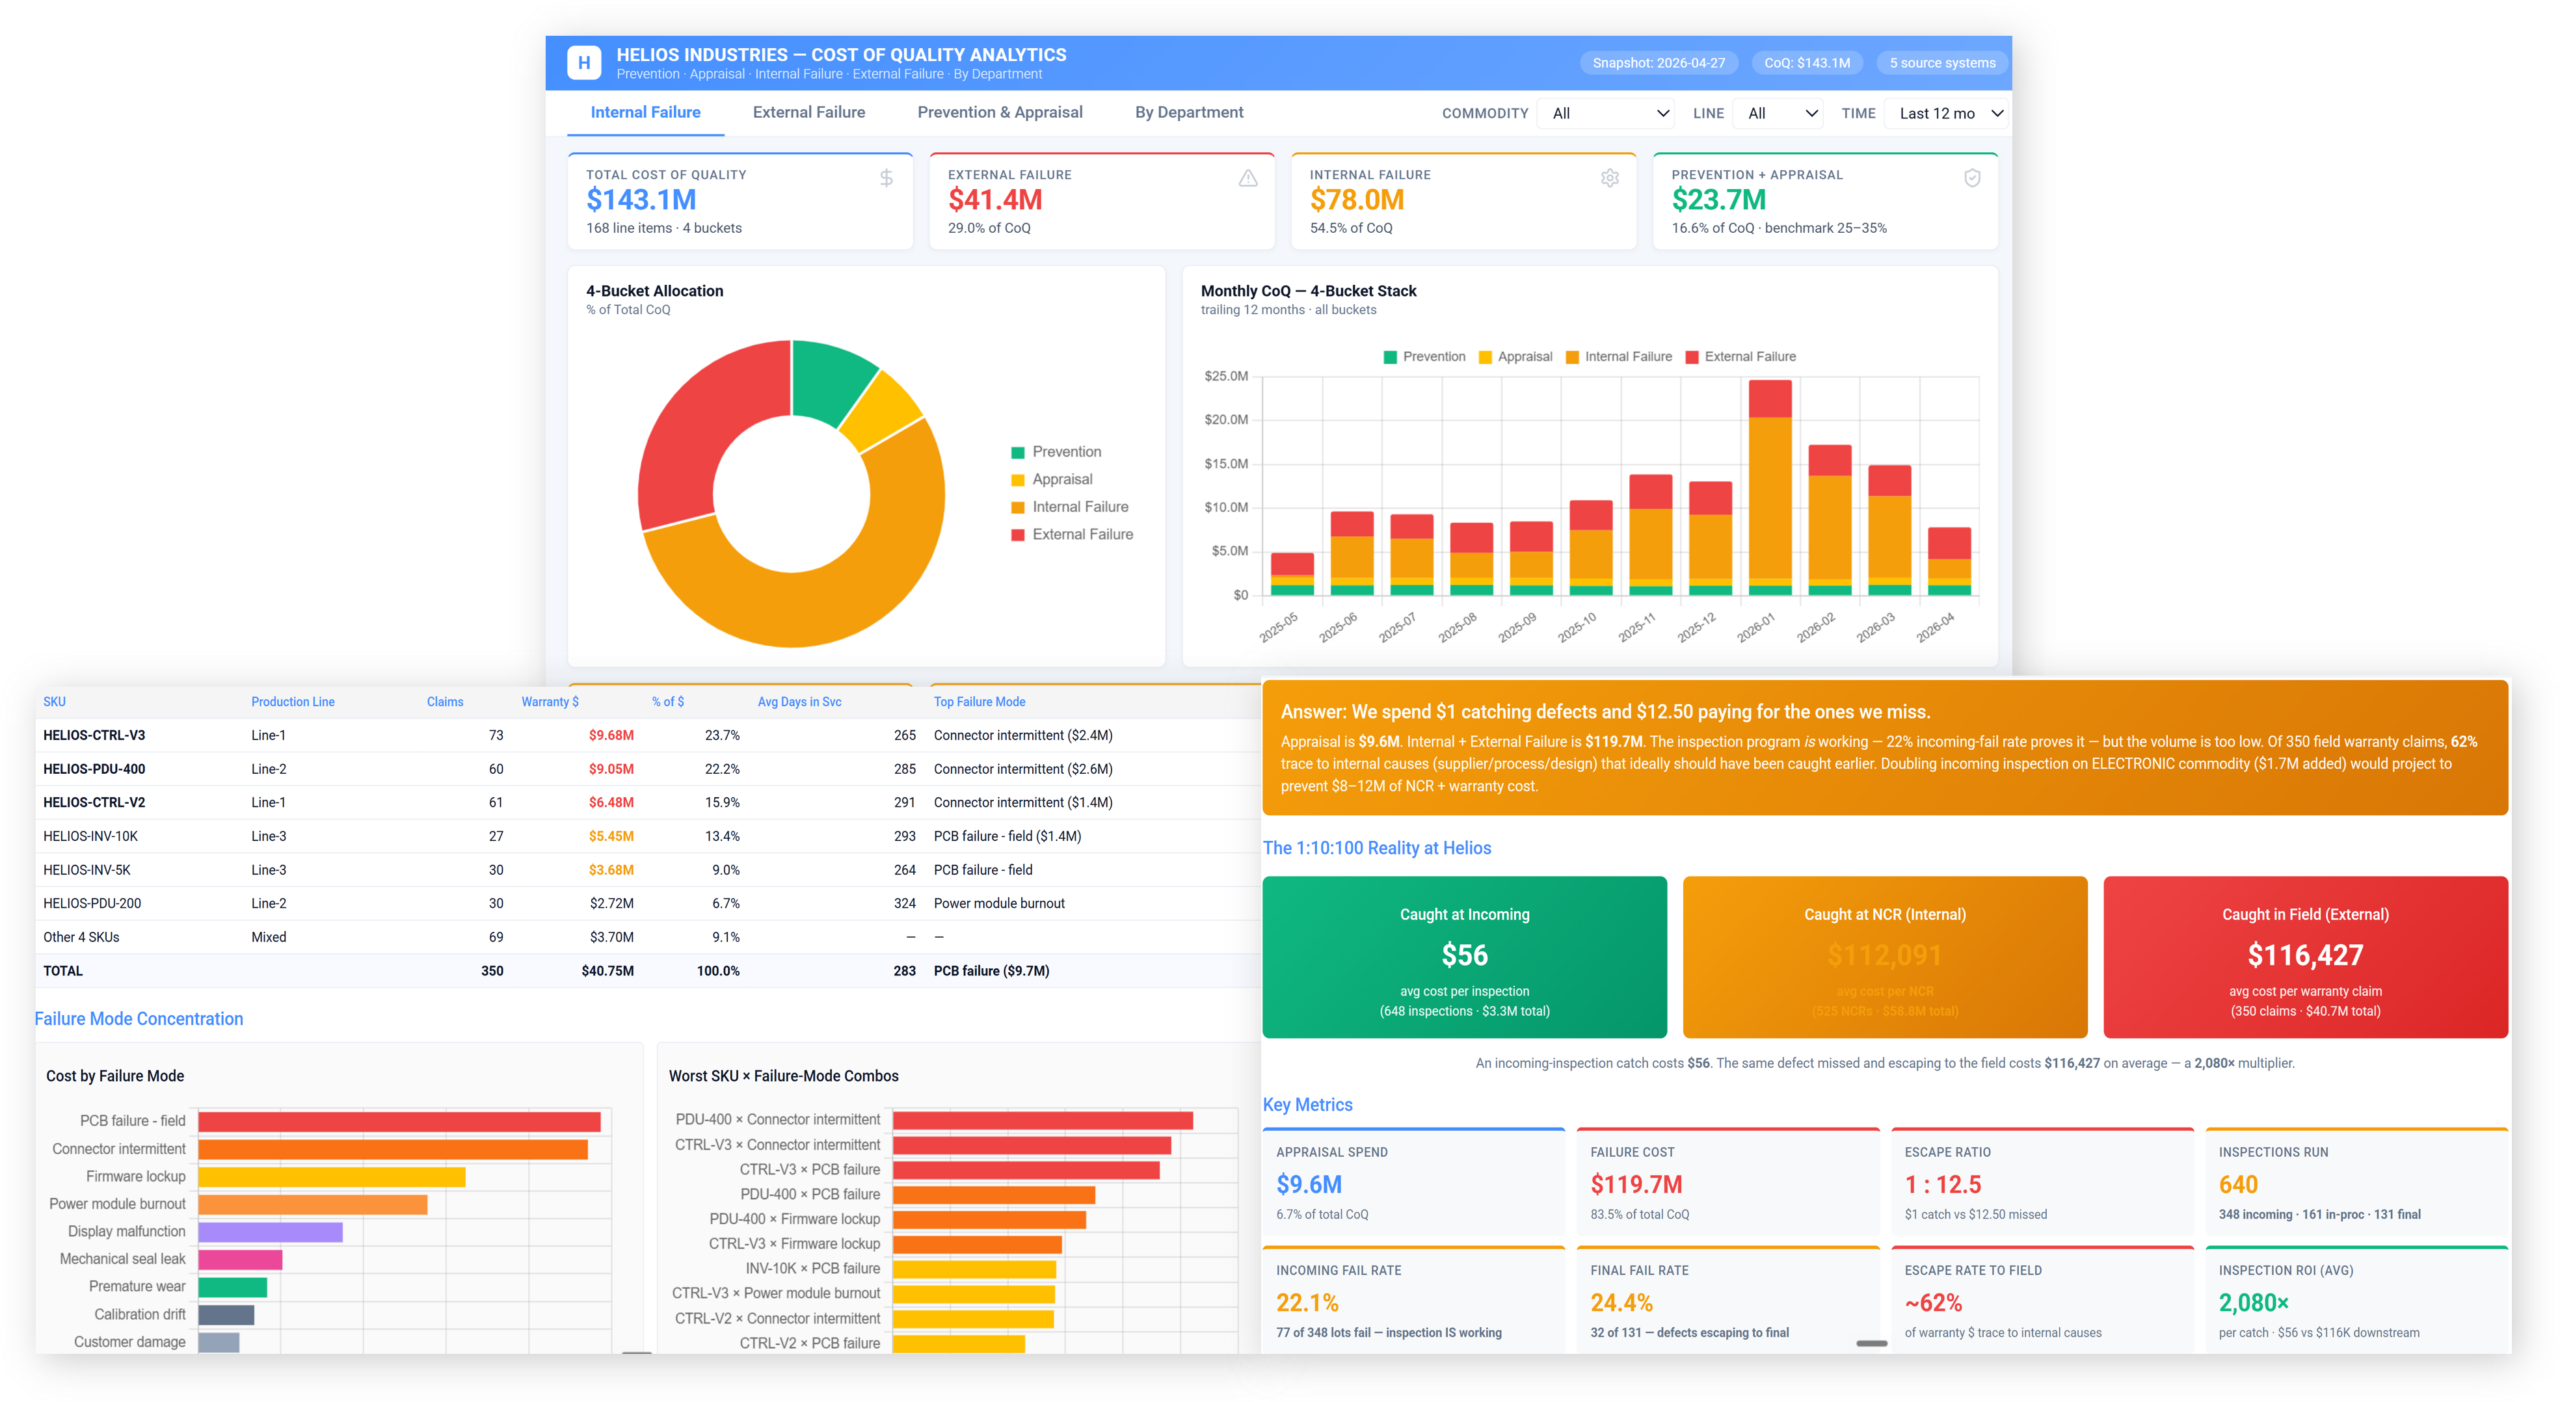
Quality & Cost of Poor Quality Analytics Is Complex - AI Can Help
Quality teams need more than defect counts. Praxie’s AI-powered Quality & COPQ Analytics connects inspection results, NCRs, scrap, rework, warranty claims, supplier quality, process signals, and financial impact so teams can find the true cost drivers, identify root causes, and prioritize corrective actions faster.
COPQ is rarely visible in one system. The real answer requires connecting cost, quality, operations, supplier, and customer data.
Instead of a feature dump, Praxie organizes quality and COPQ analytics around the real work quality, operations, finance, and plant teams need to accomplish every day: find issues faster, quantify their cost, explain the root cause, and drive corrective action.
Bring inspection, NCR, scrap, rework, warranty, customer complaint, and process signals into one quality intelligence view.
Translate quality failures into dollars by connecting defects to labor, material, downtime, warranty, returns, and containment costs.
Use AI to connect patterns across process parameters, machine settings, operators, materials, suppliers, and change history.
Convert analytics into prioritized CAPA, containment, work-instruction updates, supplier actions, and management follow-up.
A simplified view of how manufacturers move from scattered inspection data, defect reports, and spreadsheet-based quality reviews to connected AI analytics that quantify cost of poor quality, identify root causes, and drive faster corrective action.
Reduce scrap, rework, warranty, containment, and failure costs.
Spend less time building reports and more time solving problems.
Use root cause insights to prevent repeat quality escapes.
Move from issue detection to containment, CAPA, and verification faster.
Improve output by identifying process drift and high-risk conditions earlier.
Connect evidence, traceability, and actions in one quality intelligence layer.
A simple view of how manufacturers move from disconnected quality tracking and after-the-fact reporting to AI-powered analytics that finds quality issues, explains root causes, prioritizes COPQ, and drives corrective action.
Global Luxury Goods Manufacturer | Global Delivery & Service Network
A representative example of how Praxie helps a global luxury goods manufacturer connect quality data, process signals, warranty feedback, service records, and cost-of-poor-quality analytics across highly customized products delivered and maintained worldwide.
Quality, rework, warranty, supplier, and field-service costs consolidated into
one executive view.Quality teams can connect defects to build phase, supplier lots, processes, operators, parts, and service context.
End-to-end issue traceabilityDelivered luxury products are maintained and supported around the world, requiring analytics across warranty claims, service notes, parts, and geography.
Worldwide lifecycle analyticsReduced rework, warranty burden, premium freight, service travel, and avoidable part replacement.
Recurring defects are found earlier, prioritized faster, and prevented before delivery.
CAPA priorities are driven by cost, recurrence, field exposure, customer impact, and process risk.
We finally connected build quality, warranty costs, and global service data into one view of what quality is really costing us.
Clear answers to the most common questions manufacturers ask when moving from manual quality reporting and spreadsheet-based COPQ analysis to connected, AI-powered quality analytics.
Answer: AI connects quality events, production data, supplier issues, customer complaints, warranty claims, scrap, rework, and financial impact into one analytical view. Instead of only reporting defects after the fact, teams can see where quality losses are occurring, what is driving them, and which actions are likely to reduce COPQ fastest.
Answer: It can analyze structured and unstructured data from ERP, MES, QMS, inspection systems, NCRs, CAPAs, complaints, warranty records, supplier scorecards, spreadsheets, documents, images, and operator notes. The goal is to turn fragmented quality information into a unified source of insight.
Answer: Yes. AI-powered COPQ analytics can combine visible costs like scrap, rework, returns, concessions, warranty, service, and containment with hidden costs such as engineering time, expediting, lost capacity, customer dissatisfaction, and recurring failure modes. This creates a more complete view of the financial impact of quality problems.
Answer: Yes. The AI can identify patterns across defects, processes, suppliers, products, shifts, materials, machines, and locations. It helps teams prioritize likely root causes, summarize related incidents, and connect recurring quality issues that may be missed in separate systems or spreadsheets.
Answer: Traditional dashboards usually show what happened. AI-powered quality analytics explains why it happened, where it is likely to happen again, and what actions could reduce risk or cost. It adds recommendations, anomaly detection, natural-language summaries, and workflow automation on top of KPI reporting.
Answer: Yes. The system can connect field issues back to product configuration, production history, inspection records, suppliers, service notes, and cost data. This helps teams understand which issues are driving the greatest customer impact and lifecycle cost after products are delivered.
Answer: No. It supports their judgment by reducing manual analysis, organizing evidence, highlighting patterns, and recommending next steps. Quality leaders stay in control while AI helps them move faster, focus on the highest-value problems, and make better decisions with clearer data.