


 Dylan Hoback
Accu-Tube
Dylan Hoback
Accu-Tube
My Praxie analytics software transformed our operations, enabling data-driven decisions and streamlining our manufacturing process.

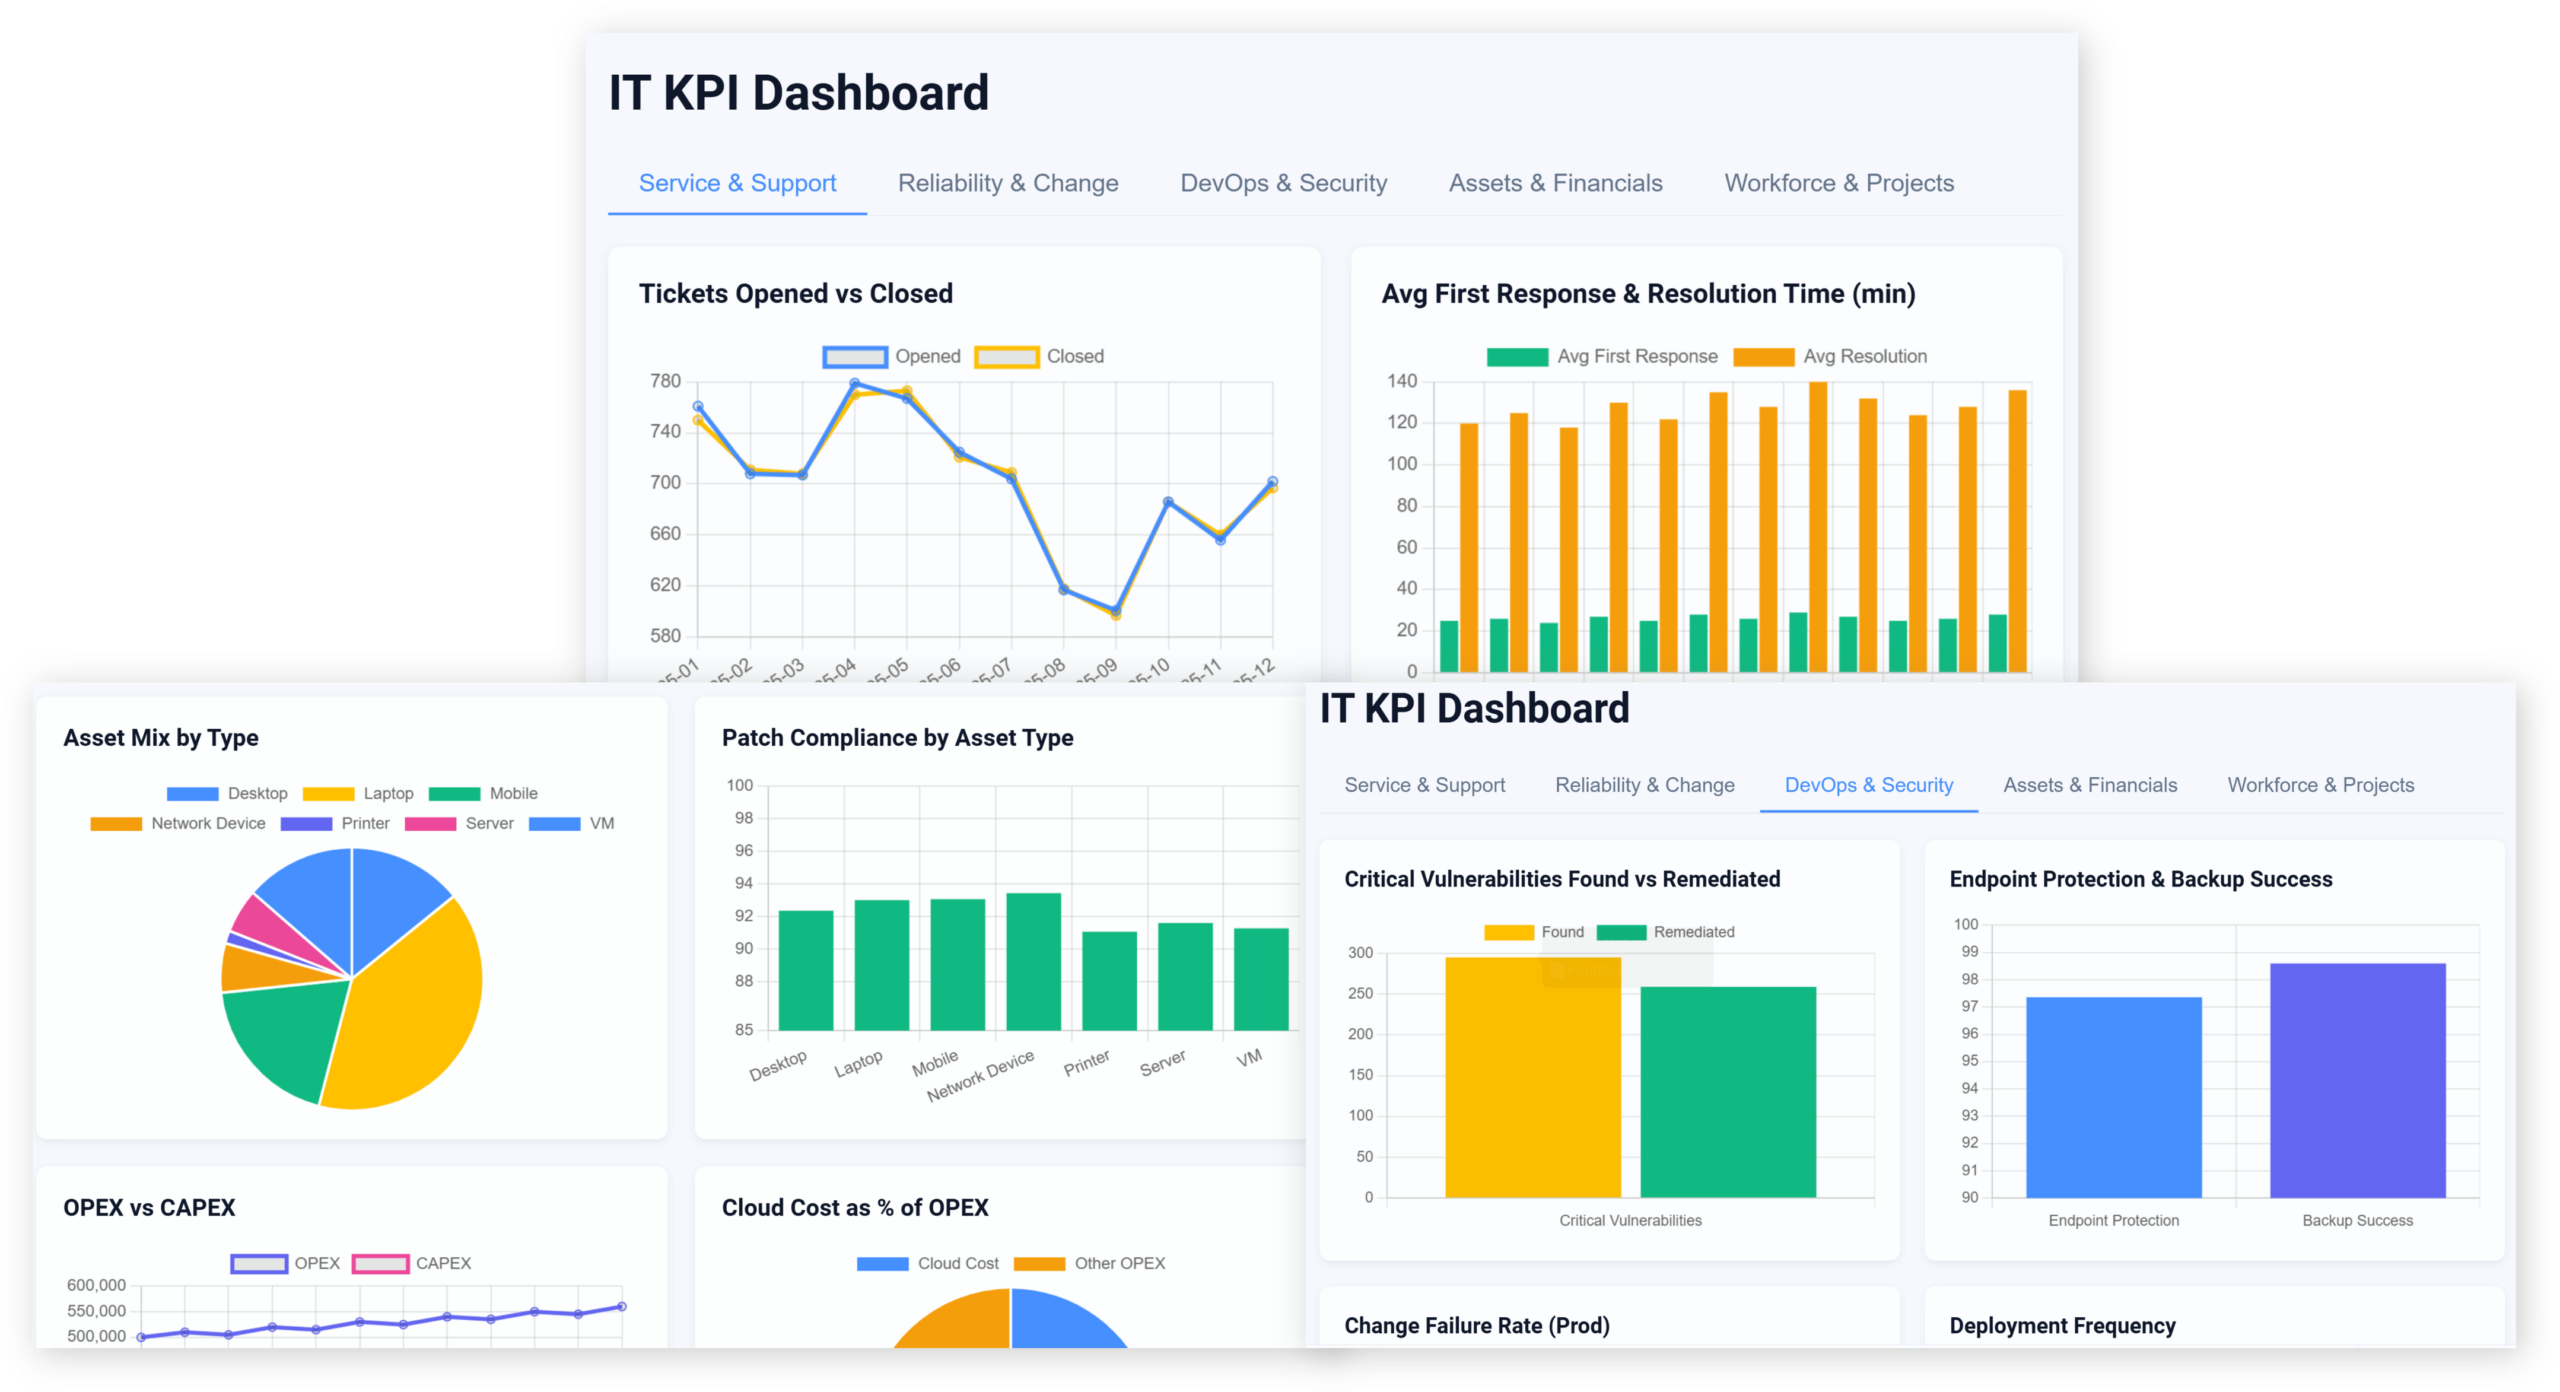
Replace availability dashboards with AI that connects spend, projects, incidents and service data — so you can answer what IT cost, what it delivered and where the risk is, in the same conversation.
AI IT portfolio analyticsfor CIOs and IT leaders
Customer Success Stories
Dylan Hoback
Accu-Tube
“My Praxie analytics software transformed our operations, enabling data-driven decisions and streamlining our manufacturing process.
 Jason Carpenter
Environmental Pest Management
Jason Carpenter
Environmental Pest Management
“With Praxie, I found a way to take what was in documents and spreadsheets and provide my team with a visual application environment to drive our strategy with full accountability.
 Elizabeth Pridham
Perfection Fresh
Elizabeth Pridham
Perfection Fresh
“Praxie dramatically improved our process through digital transformation. We now have visibility and can drive decisions at a fraction of the time.
 Scott Russell
NUCOR Vulcraft
Scott Russell
NUCOR Vulcraft
“I would heartily recommend the Praxie team to any organization seeking to seriously undertake a lasting and successful innovation process.
 Mike Bainbridge
Dover Food Retail
Mike Bainbridge
Dover Food Retail
“Our MFG Ops application greatly improved our daily management initiatives. It is easy to see how we are doing, identify issues, and track improvements—no matter where we sit.
 Jeff Piotrowicz
ChemLink
Jeff Piotrowicz
ChemLink
“With Praxie we've created a way to report on complex projects that gives management full visibility. Executives have visibility to projects, assignments, and more at their fingertips.
 Maureen Thompson
American Nurses Association
Maureen Thompson
American Nurses Association
“Our Praxie App makes it easy to track progress on strategic objectives across the organization and includes an executive-level dashboard with real-time reports to the board on key initiatives.
 Tom Anderson
Springfield Armory
Tom Anderson
Springfield Armory
“Praxie is used every day to track and analyze every aspect of production, quality, safety, and more. We improved quality by 10%.
 Peggie Pelosi
Innovators Alliance
Peggie Pelosi
Innovators Alliance
“Almost overnight, Praxie created a customized solution for our 100 member organizations across Canada to drive strategy and innovation.
 Kate Merton
Anthem
Kate Merton
Anthem
“Praxie's innovation solution stood out from other options because it can be customized so quickly to fit our exact process requirements. Plus, it is incredibly easy to use and manage.
Dylan Hoback
Accu-Tube
“My Praxie analytics software transformed our operations, enabling data-driven decisions and streamlining our manufacturing process.
Jason Carpenter
Environmental Pest Management
“With Praxie, I found a way to take what was in documents and spreadsheets and provide my team with a visual application environment to drive our strategy with full accountability.
Elizabeth Pridham
Perfection Fresh
“Praxie dramatically improved our process through digital transformation. We now have visibility and can drive decisions at a fraction of the time.
Scott Russell
NUCOR Vulcraft
“I would heartily recommend the Praxie team to any organization seeking to seriously undertake a lasting and successful innovation process.
Mike Bainbridge
Dover Food Retail
“Our MFG Ops application greatly improved our daily management initiatives. It is easy to see how we are doing, identify issues, and track improvements—no matter where we sit.
Jeff Piotrowicz
ChemLink
“With Praxie we've created a way to report on complex projects that gives management full visibility. Executives have visibility to projects, assignments, and more at their fingertips.
Maureen Thompson
American Nurses Association
“Our Praxie App makes it easy to track progress on strategic objectives across the organization and includes an executive-level dashboard with real-time reports to the board on key initiatives.
Tom Anderson
Springfield Armory
“Praxie is used every day to track and analyze every aspect of production, quality, safety, and more. We improved quality by 10%.
Peggie Pelosi
Innovators Alliance
“Almost overnight, Praxie created a customized solution for our 100 member organizations across Canada to drive strategy and innovation.
Kate Merton
Anthem
“Praxie's innovation solution stood out from other options because it can be customized so quickly to fit our exact process requirements. Plus, it is incredibly easy to use and manage.


Measuring availability was the easy part. Showing what the spend bought is the job.
“What did we get for the IT budget this year?”
“Why does every request take two quarters?”
Four dashboards of uptime, and no way to answer either question.
You do not need another dashboard. You need spend, delivery and risk in one picture — before the budget conversation.
Most CIOs and IT leaders recognise at least four of these. If you recognise six, the rest of this page is written for you.
None of this is a monitoring problem. It is a value evidence problem.
Is this you?
Worked example — multi-business-unit IT functionSeveral business units, dozens of applications, and project, spend and service data in different tools.
Because the data was never connected, IT could report availability precisely and cost-to-value only approximately — which made every budget conversation a negotiation rather than an evidence review.
With spend, delivery and service data connected, application cost, run-versus-change split and delivered benefit become reportable, and technical debt can be quantified rather than asserted.
Availability figures.
A picture of cost, delivery and risk.
Auto-model KPIs and cut manual reporting time.
Cut delays from alert to diagnosis to resolution.
Keep services within SLOs and SLAs.
Reduce waste, overruns, and idle licenses.
Connect every KPI to a clear source and owner.
Give every team the numbers to decide faster.
What question about IT can you not currently answer with data?
Now select a day and time below.
The objections we hear in the first 20 minutes — answered plainly.
Answer: The AI helps IT teams make better decisions by analyzing incidents, changes, uptime, security, and cost data across your tools. Recommendations are explainable, so teams can see why a KPI needs attention and stay in control of every reporting decision.
Answer: Yes. AI-powered dashboards identify anomalies, recurring issues, alert noise, and high-risk services before problems disrupt the business. This helps teams shift from reactive firefighting to proactive, data-driven IT management.
Answer: The AI can connect, normalize, and model data from ITSM, APM, CI/CD, SIEM, CMDB, and cloud billing — or a simple spreadsheet — into consistent KPIs. Teams get a clearer view of what matters most and why.
Answer: Yes. The system analyzes patterns across incidents, changes, outages, and metric trends to identify repeat problems, likely root causes, and improvement opportunities across services, teams, regions, or vendors.
Answer: Yes. Traditional tools often store IT data but do not actively interpret it. AI-powered dashboards connect service data, metrics, KPIs, and targets so teams can predict issues, optimize dashboards, and continuously improve reliability.
Send us one quarter of your real IT data. We’ll show you what Praxie would surface — your spend, your delivery, your risk.
No cost, no obligation — and you keep what we find either way.